還在跑R15嗎?趕快來試試最新的R20吧!
不只是跑分而已,越來越貼近實際使用體驗
實況需求?剪輯影片需求?多工多核性能需求?
單核心每核心性能足夠強大多核心性能才會真的強大
核心數話術詐騙假帳號寫手推銷!?能不能買!?該怎麼選!?性能真相!?CPU挑選選購不再有迷思!?
更準確的測試出您的新CPU真實性能一目了然明明白白清清楚楚貴在真實
在高級選項中可以啟用單核測試來測試每核心性能,也可以手動不同核心數量(最大256)
上限最大可以支援256多執行緒運算,滿足未來越來越多的非常多超多核心CPU產品
也就是理論上可支援256核心(256C/256T)的CPU,或是128核心256超執行緒(128C/256T)的CPU
2019-07-07
AMD Ryzen 9 3900X
R15 198cb(Single Core) 3096cb
R20 489cb(Single Core) 6961cb
AMD Ryzen 7 3700X
R15 200cb(Single Core) 2087cb
R20 492cb(Single Core) 4735cb
AMD Ryzen 7 2700X
R15 147cb(Single Core) 1704cb
R20 336cb(Single Core) 3761cb
Intel Core i9-9900K預設
R15 214cb(Single Core) 2076cb
R20 486cb(Single Core) 4755cb
Ryzen R5 3600預設@3.6~4.2GHz
R15 1535cb 196cb(Single Core) 170.98fps 98.0% 7.84x(MP Ratio)
R20 3510cb 483cb(Single Core) 7.26x(MP Ratio)
Ryzen R7 3700X預設@3.6~4.4GHz
R15 2085cb 198cb(Single Core) 163.24fps 98.0% 10.52x(MP Ratio)
R20 4504cb 494cb(Single Core) 9.12x(MP Ratio)
2019-06-11 AMD Next Horizon Gaming Tech Day發表會
Ryzen3950X(16C/32T,2CCD)LN2液態氮極限超頻@5.3Ghz
R15 5434cb R20 12167cb
1CCD等於2CCX組成
2CCD由2CCX(4C+4C)+2CCX(4C+4C)組成16C
2019-05-28 AMD Zen2 Ryzen3000系列 Ryzen三代發表會官方正式公開測試實測資料
Ryzen3700X(8C/16T,1CCD) R20 4806cb
1CCD由2CCX(4C+4C)組成8C
強大的Intel8代9代Core優勢依然不能小看
網路素人資料,純紀錄僅供參考
Xeon 2xE5-2680v2(20C/40T) 5197cb
Xeon E5 2699v3(18C/36T)@3305Mhz 4532cb
i9-9900K@5Ghz 4968cb 515cb(Single Core)
i7-8750H(6C/12T)@4.1Ghz 3134cb
i7-8700K@5Ghz 3826cb 519cb(Single Core) 7.37x(MP Ratio)
i7-8700K@5Ghz 3812cb 514cb(Single Core) 7.39x(MP Ratio)
i7-8700K@5Ghz 3492cb 517cb(Single Core)
i7-8700K 3372cb
i7-7700K 2291cb
i7-6950X@4299Mhz 4865cb 401cb(Single Core)
i7-6700K@4.8Ghz 2507cb 496cb(Single Core)
i7-4790K@4.7GHz 2076cb
i7-4790K@4.7GHz 2205cb 450cb(Single Core)
i7-4790K@4.7GHz 2202cb 440cb(Single Core)
i7-4790K@4.6GHz 2088cb
i7-4790K@4.4Ghz 2062cb
i7-3770K@5.1Ghz(5099Mhz) 2015cb 415cb(Single Core)
i7-3770K@4.5Ghz 1779cb 353cb(Single Core) 5.05x(MP Ratio)
i7-2600K@4.9Ghz 1844cb 362cb(Single Core) 5.09x(MP Ratio)
i7-2600K@4.9Ghz 1804cb 363cb(Single Core) 4.97x(MP Ratio)
i7-2600K@4.4Ghz 1651cb 329cb(Single Core)
i5-2500K@4.6Ghz 1262cb 335cb(Single Core)
VIA QuadCore C4650@2.0Ghz 284cb 80cb(Single Core) 3.56x(MP Ratio)
AMD Ryzen7 1700 3063cb
AMD Ryzen5 1600X 2776cb 407(Single Core) 6.82x(MP Ratio)
AMD Ryzen5 1600 2527cb
AMD Phenom II X4 945@3.0Ghz 650cb
Xeon W3175X@3.1ghz(28/56) 13035cb 418cb(Single Core) 31.18(MP Ratio)
Threadripper 2990WX@3.0ghz(32/64) 11812cb 425cb(Single Core) 27.79(MP Ratio)
Threadripper 1950X4.1ghz(16/32) 7775cb 416cb(Single Core) 18.7(MP Ratio)
Ryzen 7 2700X@4.1ghz(8/16) DDR4-3200 4209cb 426cb(Single Core) 9.89(MP Ratio)
Ryzen 7 2700X@3.7ghz(8/16) 4055cb 437cb(Single Core) 9.29(MP Ratio)
Ryzen 7 1800X@3.98ghz(8/16) DDR4-3200 3792cb 401cb(Single Core) 9.46(MP Ratio)
Ryzen 7 1700X@3.4ghz(8/16) 3469cb 361cb(Single Core) 9.61(MP Ratio)
Ryzen 7 2700@3.2ghz(8/16) 3448cb 411cb(Single Core) 8.39(MP Ratio)
Ryzen 5 2600X@3.6ghz(6/12) DDR4-3200 3013cb 409(Single Core) 7.37(MP Ratio)
Ryzen 5 2600X@3.6ghz(6/12) 2985cb
FX-8350@4ghz(4/8) 1221cb
FX-8350@4.02ghz(4/8) 1174cb
Ryzen 5 2500U(Mobile)@2ghz(4/8) 1084cb 285cb(Single Core) 3.81(MP Ratio)
8600K@4.8Ghz 2824cb
Intel Xeon E3-1231v3(OC 3.8Ghz) 1816cb
i7 2600K 1611cb
AMD FX-9590@4.7Ghz 1516cb
AMD FX-9590@4920Mhz 1641cb
AMD FX-9590@5020Mhz(1.57v) 1673cb
FX 8370@4.2GHz 1358cb
Phenom II 1055T 905cb 174cb(Single Core)
Phenom II 1055T@3GHz 1000cb 202cb(Single Core)
Phenom II 1055T@3.5GHz 1167cb 202cb(Single Core)
i3-5006U 504cb
i5-5200U 586cb
i5-3220M 571cb 224cb(Single Core)
Core 2 Q8400@3GHz 626cb
Core 2 Q8400@3.16GHz 722cb 192cb(Single Core)
intle Xeon Platinum 8168(48C/96T)@2.7Ghz 16536cb
intle Xeon Platinum 8170(52C/104T)@2.1Ghz 16480cb
?(36C/72T)@3Ghz 13755cb
intle Xeon Gold 6134 CPU(16C/32T) 7286cb
intle Xeon Gold 6128 CPU(12C/24T) 5708cb
intle Xeon E3-1505Mv6(4C/8T) 1917cb 402cb(Single Core)
Xeon E-2146G(6C/12T) 3315cb
i9-9980XE 10741cb
9920X@4.8Ghz 7079cb
9820X@4.7Ghz 6152cb 486cb(Single Core)
i9-7980XE@5.0Ghz 11520cb
i9-7980XE@4.9Ghz 11079cb
i9-7980XE@4.6Ghz 10572cb 474cb(Single Core)
i9-7980XE(18C/36T) 10586cb
i9-7980XE預設 7971cb 452cb(Single Core)
i9-7980XE預設 7884cb
i9-7980XE 516cb(Single Core)
i9-7980XE 8964cb
i9-7940X 4.5G avx-3 mesh3.2G 8315cb 468cb(Single Core)
7940X預設 2133四通道 6284cb 409cb
i9-7920X(12C/24T) 7818cb
i9-7920X 7224cb
i9-7900X@4.8Ghz 6371cb 499cb(Single Core)
i9-7900X(10C/20T) 6030cb 475cb(Single Core)
i9-7900X預設 5273cb 455cb(Single Core)
i9-9900K@5.4Ghz 5789cb 570cb(Single Core)
i9-9900K關閉HT@5.5Ghz 4536cb 581cb(Single Core)
i9-9900K@5.4Ghz 563cb(Single Core)
i9-9900K@5.2Ghz 5526cb
i9-9900K@5.2Ghz 5555cb 544cb(Single Core)
i9-9900K(8C/16T) 5346cb
i9-9900K@5Ghz 5333cb 512cb(Single Core)
i9-9900K@5Ghz 5290cb
i9-9900K@5Ghz 4990cb
i9-9900K全核@4.8Ghz 5006cb
i9-9900K 5059cb 512cb(Single Core)
i9-9900K預設 4981cb 519cb(Single Core)
i9-9900K預設 4873cb
i9-9900K關閉HT 4536cb 581cb(Single Core)
i7-9700K@5.0Ghz DDR4-3000 16GBx2 3761cb 522cb(Single Core)
i7-8086@5.0Ghz 3972cb
i7-8700K@4.5Ghz 3450cb
i7-8700K關閉ht(6C/6T) 2938cb 498cb(Single Core)
i5-8600K(6C/6T)@5Ghz 2931cb 522cb(Single Core)
i5-8600K 2718cb 489cb(Single Core)
i5-8500(6C/6T) 2379cb
i5-8400 394(Single Core)
i3-8350K 1940cb 501cb
i3-8350K@4.9Ghz 1844cb 497cb(Single Core)
i7-7700K@4.8Ghz avx-2 ring4.5G 2435cb 474cb(Single Core)
6950X 4929cb 399cb
6900K@3.5Ghz 3454cb 348cb(Single Core)
i7-5820K@4.5Ghz 3054cb 414cb(Single Core)
筆電9900K預設 4641cb(Single Core)
i7 8750H(6C/12T) 2550cb
i7-8550U(4C/8T) 1434cb
i7-8550U(4C/8T) 1371cb 403cb(Single Core)
i5-8265U(4C/8T) 1269cb 365cb(Single Core)
8250U 1200cb 351cb(Single Core)
i7-4790K@4.2Ghz 2008cb 401cb(Single Core)
i7-4790K 1851cb 391cb(Single Core)
i7-4790K預設 1760cb 381cb(Single Core)
i7-4790K預設 1751cb 361cb(Single Core)
i7-4790K 1995cb
6300u 614cb
i5-5200U(2C/4T) 502cb
G4620(2C/4T) 853cb 320cb(Single Core)
G4600(2C/4T) 839cb 327cb(Single Core)
G3220(2C/2T) 254cb
Xeon E31260L 865cb
posCinebench - R20 - 48x CPU 2x Intel Xeon Platinum 8168 at 3490.3MHz 17321cb
Cinebench - R20 - 40x CPU 4x Intel Xeon E7 8870 at 2400MHz 7002cb
Cinebench - R20 - 36x CPU 2x Intel Xeon Gold 6154 at 3000MHz 14324cb
Cinebench - R20 - 32x CPU AMD 2990W(32C/64T)@4146MHZ 15430cb
Cinebench - R20 - 24x CPU 4x Intel Xeon MP X7460 at 3086MHz 4161cb
Cinebench - R20 - 20x CPU 2x Intel Xeon E7 8870 at 2527MHz 3769cb
Cinebench - R20 - 18x CPU Intel Core i9 7980XE at 5000MHz 11642cb
Cinebench - R20 - 16x CPU Intel Core i9 7960X at 4605.4MHz 9571cb
Cinebench - R20 - 12x CPU Intel Core i9 7920X at 4800MHz 7602cb
Cinebench - R20 - 10x CPU Intel Core i9 7900X at 4800MHz 6402cb
Cinebench - R20 - 8x CPU Intel Core i9 9900K at 5900MHz 5957cb
Cinebench - R20 - 6x CPU Intel Core i7 8086K at 5425MHz 4368cb
Cinebench - R20 - 4x CPU Intel Core i7 7700K at 5300MHz 2854cb
Cinebench - R20 - 2x CPU Intel Core i3 7350K at 5200MHz 1428cb
2990W(32C/64T) 13620cb 435cb(Single Core) 31.33x(MP Ratio)
2990W 11632cb 414cb(Single Core)
2950X預設 6720cb
1950X(16C/32T)預設 6702cb 383cb(Single Core)
1950@4Ghz 1.4v 6997cb 407cb(Single Core)
1950@4Ghz 7723cb
2700X全核4.35Ghz 雙通道3666c14 4501cb 449cb(Single Core)
2700X全核4.35Ghz 雙通道3666c16 4493cb 450cb(Single Core)
2700X PBO all@4.0G single@4.3G 3901cb 429cb(Single Core)
2700X oc@4.2Ghz 4296cb 434cb(Single Core)
2600全核@4.2Ghz 3163cb 428cb(Single Core)
1700X 3911cb 390cb(Single Core)
1700 oc@3.8Ghz 3740cb 381cb(Single Core)
1700@3.8Ghz 377cb 386cb(Single Core)
Ryzen5 Pro 2500U(4C/8T) 1122cb 330cb(Single Core)
2200G 1281cb
i9-7980XE@4.62Ghz 10951cb
i7-79820X@4.7Ghz 4815cb 482cb(Single Core)
2xE5-2697v2(24C/48T)5984cb
E5-2690(8C/16T) 2451cb 266cb(Single Core)
9900K@allcore全核5.1Ghz 5282cb 523cb(Single Core)
9900K@allcore全核5.0Ghz 5118cb 506cb(Single Core)
9900K@5.0Ghz 5209cb 523cb(Single Core)
9900K@4.7Ghz 4854cb 476cb(Single Core)
9900K@5.0Ghz 5097cb
9900K 5267cb
9900K 5185cb 518cb(Single Core)
9900K預設 4974cb
9900K預設時脈 4936cb
i9-9900K預設時脈 4966cb 525cb(Single Core)
i7-9700K@5.005Ghz 4079cb 522cb(Single Core)
i5-9600K@5Ghz 2910cb 521cb(Single Core)
i5-9600K@4.6Ghz 2743cb 479cb(Single Core)
i5-9400F 2326cb 409cb(Single Core)
8086K@全核5Ghz 3891cb
8700K@5.1Ghz 4158cb 541cb(Single Core)
8700K@5Ghz 4028cb
8700K 3985cb
8700K 3751cb 492cb(Single Core)
8700全核4.3Ghz 3442cb 450cb(Single Core)
8700 3288cb 447cb(Single Core)
8600K@4.9Ghz 2852cb 510cb(Single Core)
8600K@4.6Ghz 2600cb
i5 8400 2244cb
7900X 6043cb 483cb(Single Core)
7900X@4.4Ghz 5719cb
7900X@4Ghz 5091cb
6950X@4.2Ghzz 4231cb
6700 1939cb
6600 1416cb 398cb(Single Core)
5820K全核4.3Ghz 2627cb 387cb(Single Core)
E3-1230 V3 1520cb 320cb(Single Core)
E3-1230 V3 1668cb 304cb(Single Core)
i5 3350p 892cb
i3 2120 589cb
i9-8950HK 3440cb 446cb(Single Core)
i7-8750H 2454cb 417cb(Single Core)
i7-8750H 2573cb 398cb(Single Core)
i7-8565U 1319cb
i5 7300HQ 1225cb 338cb(Single Core)
i5 7300HQ 1143cb 324cb(Single Core)
i7-4720HQ 1469cb
i7-3720QM 1206cb 272cb(Single Core)
i7-3615QM 965cb 226cb(Single Core)
7200U 764cb 314cb(Single Core)
EPYC7521x2@2.1Ghz 4171cb
EPYC7521x2@2.1Ghz 3907cb
2950X預設 6896cb
2700E@4.1Ghz 4215cb 424cb(Single Core)
2700pro@4.05Ghz 4102cb
R7-2700X全核allcore@4.3Ghz 4143cb
R7-2700X@4.2Ghz 4303cb 436cb(Single Core)
R7-2700X@4.13Ghz 4083cb
R7-2700X全核@4.2Ghz PBO+PE4 4113cb 437cb(Single Core)
R7-2700X全核@4Gghz 4024cb
R7-2700X全核@4Gghz 3925cb
R7-2700X@4Ghz 4077cb
R7-2700X@4Ghz 3958cb 434cb(Single Core)
R7-2700X 3991cb 430cb(Single Core)
R7-2700@4.1ghz 3992cb
R7-2700@4Ghz 3924cb 409cb(Single Core)
R5-2600X@4.2Ghz 3175cb
R5-2600X@4.225Ghz 3257cb
R5-2600X@3.95Ghz 3033cb
R5-2600X 3125cb 352cb(Single Core)
R5-2600X 3024cb
R5-2600X PBO+PE Level 2 2827cb 406cb(Single Core)
R5-2600X 2984cb 414cb(Single Core)
R5-2600X@3.6ghz 2795cb
R5-2600X 2951cb
R5-2600X 2921cb 415cb(Single Core)
R5-2600@4.1Ghz 3078cb 423cb(Single Core)
R5-2600@4.0Ghz 3103cb 412cb(Single Core)
R5-2600@4Ghz 3049cb 410cb(Single Core)
R5-2600 2890cb 389cb(Single Core)
R5-2600@3.6ghz 2494cb
R5-2600@3.4ghz 2660cb
R5-2600 2669cb
R5 2600 2695cb 386cb(Single Core)
1800X@3.7ghz 3575cb 380cb(Single Core)
1700@3.9Ghz水冷 3863cb
1700@3.8Ghz 3770cb
1700@3.875ghz 3703cb 382cb(Single Core)
1700@3.8ghz 3843cb 388cb(Single Core)
1700@3.5Ghz 3474cb
1600X@3.8Ghz 2820cb 382cb(Single Core)
1600X@3.8Ghz 2758cb 382cb(Single Core)
1600@3.8ghz 2866cb 383cb(Single Core)
1600@3.8ghz 2827cb 386cb(Single Core)
1600@3.8ghz 2776cb
1600@3.7Ghz 2711cb
1600@3.6ghz 2481cb 361cb(Single Core)
R3 1200@3.9ghz 1458cb 387cb(Single Core)
技術訊息支援的系統
PC個人計算機
|
TECHNICAL INFORMATIONSupported Systems |
Maxon Releases Cinebench R20 Benchmark
by Ian Cutress on March 5, 2019 2:38 PM EST- posted in
- CPUs
- Benchmarks
- CineBench

One of the key benchmarks that have been used in the industry is Cinebench. The latest version has been Cinebench R15, released for version 15 of Cinema 4D. In recent years it has slowly become less relevant, as Maxon has moved through to version 19 and 20 of the software. To match the latest version of the software, the company has now launched the Cinebench R20 benchmark.
The benchmark is already available from the Maxon website, working through the Windows Store or the Apple App Store on Macs. It does not look like there is a separate standalone download.
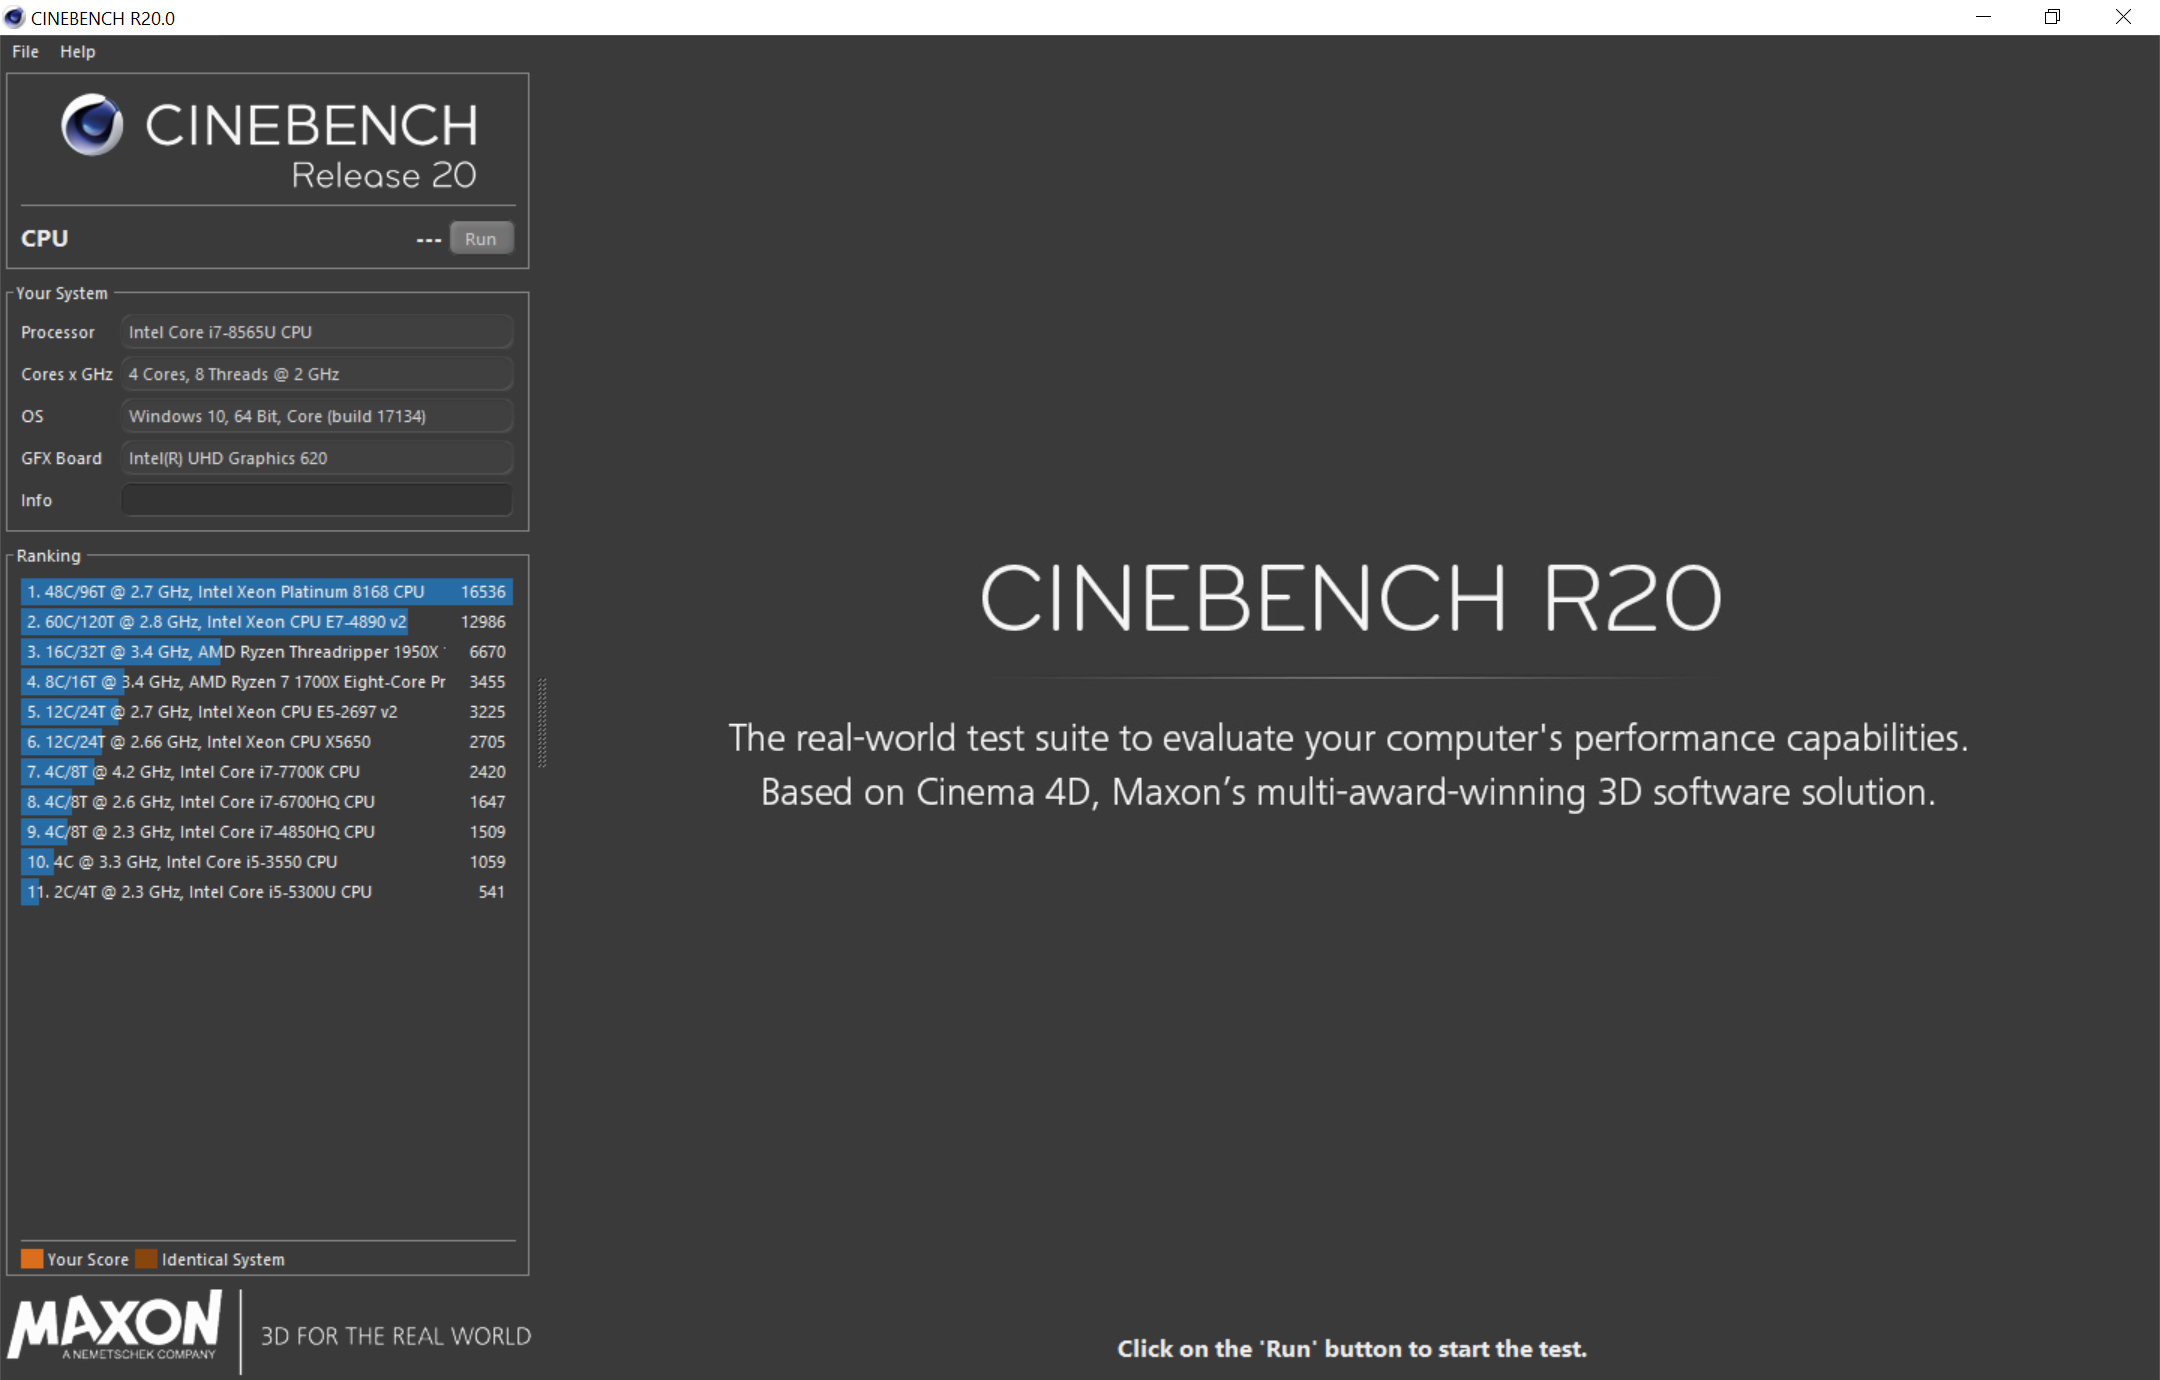
The new benchmark implements a number of new features available for x86 processors. This includes newer AVX instructions, implemented through Intel's Embree raytracing technology, applicable on both AMD and Intel processors. The new benchmark focuses purely on CPU performance, and solves one of the issues with the R15 version - it now scales beyond 64 threads better by having a larger scene. There will be a minimum performance limit to run the new benchmark, which is listed as a memory limit.
Similar to R15, there is a single threaded test and a multithreaded test. The GPU test has been dropped (it hasn't been relevant for a long time).
多核心性能:
For performance, the following results are provided as standard in the benchmark download:
- 2x Xeon Platinum 8168, 48C/96T: 16436 points
- 4x Xeon E7-4890 v2, 60C/120T: 12986 points
- Ryzen Threadripper 1950X, 16C/32T: 6670 points
- Ryzen 7 1700X, 8C/16T: 3455 points
- Xeon E5-2697 v2, 12C/24T: 3225 points
- 2x Xeon X5650, 12C/24T: 2705 points
- Core i7-7700K, 4C/8T: 2420 points
- Core i7-6700HQ, 4C/8T: 1647 points
- Core i7-4850HQ, 4C/8T: 1509 points
- Core i5-3550, 4C/4T: 1059 points
- Core i5-5300U, 2C/4T: 514 points
With my Whiskey Lake Core i7-8565U that I'm writing this news post on, I scored 1245 points.
單核心每核心性能:
For the single core benchmark, the numbers are:
- Intel i7-7700K: 476 points
- AMD 1950X: 400 points
- Platinum 8168: 379 points
- AMD 1700X: 378 points
- Intel i7-6700HQ: 359 points
- Intel i7-4850HQ: 298 points
- Intel i5-3550: 283 points
- Intel i5-5300U: 280 points
- Xeon E5-2697 v2: 255 points
- Xeon E7-4890 v2: 197 points
- Xeon X5650: 191 points
The link to Maxon's page is as follows:
https://www.maxon.net/en/products/cinebench-r20-overview/
We will be looking to see if we can roll this benchmark out across our CPU suite.
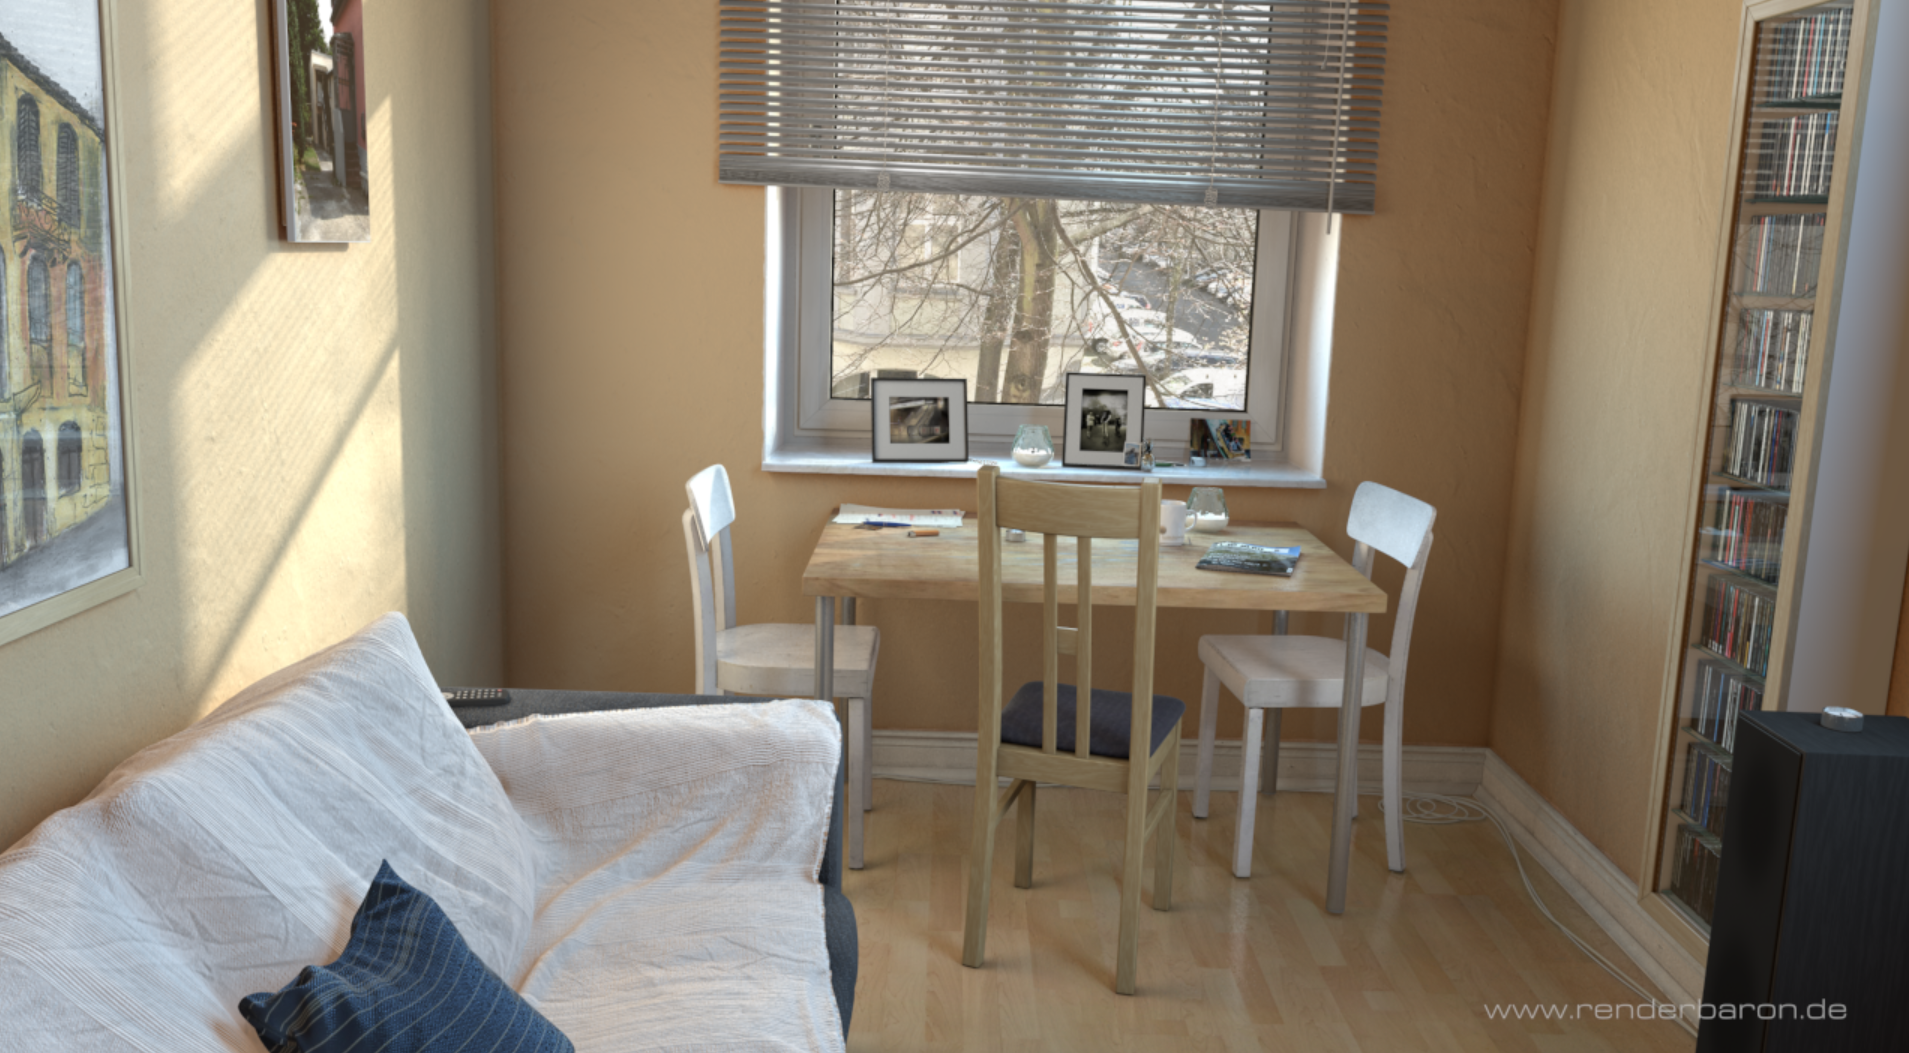
The scene being rendered
新聞來源https://www.anandtech.com/show/14053/maxon-releases-cinebench-r20-benchmark
延伸閱讀[檢測軟體]TechPowerUp 發布 GPU-Z v2.17.0 https://blog.xuite.net/jodenh/jOrz/586949109
http://blog.xuite.net/jodenh/jOrz
我的文章https://blog.xuite.net/jodenh/jOrz/586994505
更多文章https://blog.xuite.net/jodenh/jOrz
/jodenh/jOrz
Freebitcoin領取免費比特幣時時刻刻免費比特幣 每1小時可領取一次
Freedogecoin領取免費狗狗幣時時刻刻免費狗狗幣 每1小時可領取一次
eobot FreedailyDogecoin dailyFaucet mining領取每日狗狗幣獎勵與多種數位貨幣
Minergate人人都會的挖礦懶人無腦自動智能挖礦自己的幣自己挖XD
kryptex.org懶人挖礦比特幣打工仔的新救星w

 留言列表
留言列表